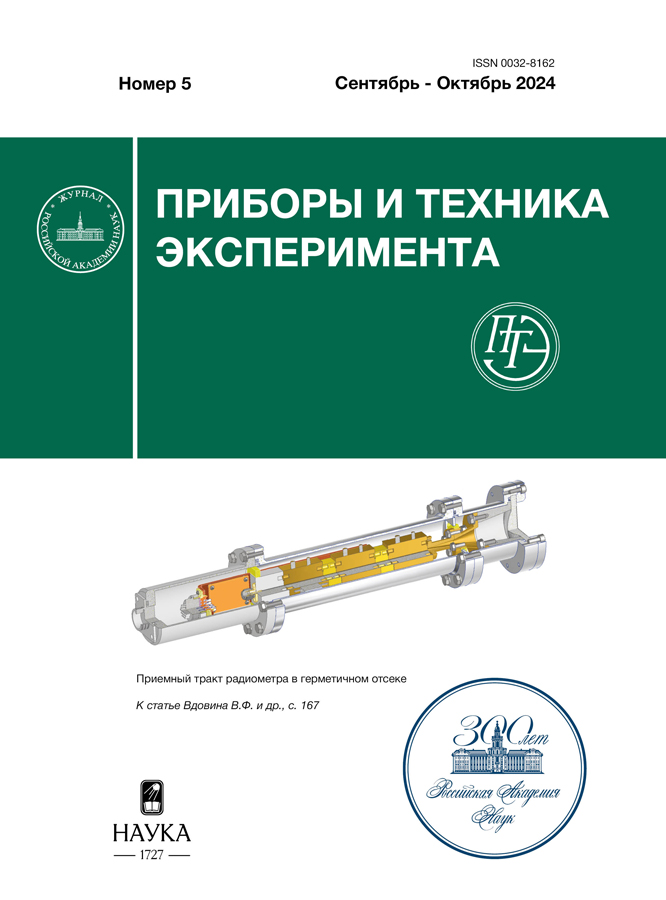
Позиционно-чувствительный черенковский монитор протонного пучка
- 作者: Акулиничев С.В.1,2, Гаврилов Ю.К.1, Джилкибаев Р.М.1
-
隶属关系:
- Институт ядерных исследований Российской академии наук
- Российский научный центр хирургии им. Б.В. Петровского
- 期: 编号 5 (2024)
- 页面: 154-160
- 栏目: ФИЗИЧЕСКИЕ ПРИБОРЫ ДЛЯ ЭКОЛОГИИ, МЕДИЦИНЫ, БИОЛОГИИ
- URL: https://vestnik-pp.samgtu.ru/0032-8162/article/view/682646
- DOI: https://doi.org/10.31857/S0032816224050172
- EDN: https://elibrary.ru/EROTST
- ID: 682646
如何引用文章
详细
Представлены результаты исследования нового черенковского монитора протонных пучков с большим импульсным током. Для пучков протонов с энергией 160 МэВ и импульсным средним током 1 мА получено хорошее согласие измерений монитора с данными пленочного детектора Gafchromic и индукционного датчика тока. Проведены стендовые измерения координаты положения светового потока, имитирующего световой образ протонного пучка в радиаторе двухкоординатного монитора. Представлен сравнительный анализ алгоритмов восстановления координаты положения светового пучка с результатами моделирования монитора.
全文:
作者简介
С. Акулиничев
Институт ядерных исследований Российской академии наук; Российский научный центр хирургии им. Б.В. Петровского
Email: rmd@inr.ru
俄罗斯联邦, 117312, Москва, просп. 60-летия Октября, 7а; 119435, Москва, Абрикосовский пер., 2
Ю. Гаврилов
Институт ядерных исследований Российской академии наук
Email: rmd@inr.ru
俄罗斯联邦, 117312, Москва, просп. 60-летия Октября, 7а
Р. Джилкибаев
Институт ядерных исследований Российской академии наук
编辑信件的主要联系方式.
Email: rmd@inr.ru
俄罗斯联邦, 117312, Москва, просп. 60-летия Октября, 7а
参考
- Favaudon V., Caplier L., Monceau V. et al. // Sci. Transl. Med. 2014. V. 6. № 245. P. 245ra93. https://doi.org/10.1126/scitranslmed.3008973
- Джилкибаев Р.М. //ПТЭ. 2021. № 4. С. 10. https://doi.org/10.31857/S0032816221040145
- Акулиничев С.В., Гаврилов Ю.К., Джилкибаев Р.М. // ПТЭ. 2023. № 3. С. 5. https://doi.org/10.31857/S0032816223020131
- GAFchromic radiology, radiotherapy. http://www.gafchromic.com/
- Boag J.W. Ionization chamber in radiation dosimetry. New York: Press Academic, 1968.
- McDonald J., Velissaris C., B. Viren B. et al. // Nucl. Instrum. Methods. Phys. Res. A. 2003. V. 496. P. 293. https://doi.org/10.1016/S0168-9002(02)01768-0
- Абрамов А.И., Казанский Ю.А., Матусевич Е.С. Основы экспериментальных методов ядерной физики. Москва: Атомиздат, 1970.
- Reinhardt-Nikoulin P., Gaidash V., wMenshov A. et al. // Problems of Atomic Science and Technology. Series: Nuclear Physics Investigations. 2006. № 2 (46). P. 113.
- Дьяченко А.Ф. // Вестник Харьковского университета, серия физика. 2010. № 887. Вып. 1(45). С. 118.
- Hamamatsu Photonics https://www.hamamatsu.com
- Akopjanov G.A., Inyakin A.V., Kachanov V.A., Krasnokutsky R.N. et al. // Nucl. Instrum. Methods. 1977. V. 140. P. 441.
- CAEN DT5720. 4-channel 12 bit waveform digitizer. http://www.caen.it
补充文件


